Showing posts with label atlas. Show all posts

Wednesday, 4 December 2019

Benchmarking Springtail Recording

Recently, I've been thinking a lot about occupancy models for invertebrates. Other taxa, notably birds and butterflies (through the BTO Wetland Bird Survey and Butterfly Conservation's UK Butterfly Monitoring Scheme (UKBMS), respectively) have good negative data, i.e. an indication of where species are absent as well as where they are present. For most invertebrate taxa, partly because of lack of resource (recording effort) but mostly because of the inefficiency of recording (how can you be sure a springtail is absent from a particular area?), all we have are "White Holes" - gaps in the data which are difficult to interpret. This makes occupancy models difficult if not impossible to derive. The alternative is to fall back to benchmark species as indicators of recording coverage. Previously (Progress on the VC55 Springtail Atlas) I discussed the use of Orchesella cincta as a benchmark species for springtails. While the ubiquity of this species is a good reason to think that this is a valid choice, I've never actually tested the hypothesis - so here we go.

Heatmaps are pretty but inevitably focus attention on where the data is, rather than where it is missing. As an attempt to try to switch the emphasis I have used quadrat mapping - arbitrarily dividing VC55 into a grid and looking at the number of records within each section. A 25x25 grid worked but the the intervals were a bit small and a 10x10 grid is more informative (all VC55 Collembola records to end 2018):


The grid for Orchesella cincta looks like this:


To make sense of this, I converted the distributions into histograms:


These look pretty similar, but to be sure, I ran some further analysis:


There's a good correlation between the Orchesella cincta distribution and the overall Collembola dataset, and this is statistically significant (p = 2.2e-16). Thus Orchesella cincta is a good benchmark for springtail recording effort (at least in VC55). Phew!


Acknowledgements:
All data Copyright Leicestershire and Rutland Environmental Records Centre.
Data visualization performed using the R platform, v. 3.6.1 (R Core Team (2014) R: A language and environment for statistical computing. R Foundation for Statistical Computing, Vienna, Austria. http://www.R-project.org).
J. Cann for assistance with data visualization.

Thursday, 5 September 2019

Progress on the VC55 Springtail Atlas

I have to admit that my springtail work has been on the back burner over the last month for a number of reasons. Summer is a good time to have a break and recharge the batteries, although the difference between the drought summer of 2018 and the wet August of 2019 is dramatic. What I have done recently is to take a look at the VC55 springtail records and do some data visualization using the R platform. Firstly, I mapped all previous VC55 springtail records (n = 560) to the end of 2018 (black squares) (all data copyright Leicestershire and Rutland Environmental Records Centre), then overlaid the records added in 2019 (blue triangles):


click for larger image

This is encouraging because although there are a few other people sporadically recording springtails in VC55, I have specifically targeted most of my efforts this year at extending the geographical coverage into new areas. This is particularly important because so much biological recording defaults to the regular honeypots. It is easy to see this by merging the dataset into a heatmap of observations:


click for larger image

I can make this a little more informative by breaking down the records into families and overlaying this on the heatmap:


click for larger image

The problem with this is that the data set (~600 records) just isn't large enough to say very much about the whole County, or to put it another way, the density of records is too low for good geographical coverage. In addition, there's another problem. I'm not aware of any systematic springtail recording which includes negative results, i.e. the absence of species as well as the presence. We know (anecdotally and from the heatmap) that recording effort is not equally distributed, but the limited dataset means that we simply don't have accurate geographical coverage. Resource limitations mean that there will probably never be widespread systematic recording of springtails, so my approach to this problem has been to adopt a benchmark species to infer recording effort. Orchesella cincta is said to be the most widely distributed species in lowland Britain, so I have adopted this to infer geographical coverage:


click for larger image

Thankfully (for my theory), the O. cincta data fits the heatmap pretty well, so validating this proxy for our atlas. What comes next is clearly getting off my backside and getting back out in the field :-)


Acknowledgements:
  • All data Copyright Leicestershire and Rutland Environmental Records Centre.
  • Data visualization performed using the R platform, v. 3.6.1 (R Core Team (2014) R: A language and environment for statistical computing. R Foundation for Statistical Computing, Vienna, Austria. http://www.R-project.org).
  • J. Cann for assistance with data visualization.


Saturday, 16 February 2019

All About Orca

Processing and storage of biological records can be haphazard, there is no one agreed standard used by all. Watsonian Vice Country Recorders use an array of different solutions to keep their records, although these ultimately (should) feed though to the network of Local Environmental Records Centres. At least some of this data may (eventually) feed through to the National Biodiversity Network (NBN) and the Global Biodiversity Information Facility (GBIF). There is no overarching, agreed software solution and no data pipeline connecting them all. There are many reasons for this, lack of funding, historical inertia, issues around data quality, ownership and reuse, etc. In the 21st Century, this is frustrating. In VC55 (Leicestershire and Rutland) we are very lucky in having two dedicated and hardworking teams involved in biological recording, NatureSpot and the Leicestershire and Rutland Environmental Records Centre (LRERC). And it feels like we’re making progress. LRERC has moved to using the ORCA (On-line Record Centre Administration) software created by Tim May of Cofnod (North Wales Environmental Information Service). Verified records from individual recorders and from NatureSpot is stored and processed using this system. Since becoming VC55 County Co-ordinator for Collembola, I have been working with the LRERC staff to investigate how I can make best use of Orca. Very generously, they have allowed the use of the VC55 Collembola data as a test case to work out a few issues around Orca, and I have just had my first experience as an Orca user. Because of resource limitation (and data issues), LRERC Orca is not publically available and access is limited to County Recorders.

As I understand it, Orca is a front end to an SQL database written in Microsoft Visual Studio by Adtec Software Ltd. LRERC Orca now has a total of 560 verified Collembola records in the system, dating from 2010-2018. Unfortunately there is no automatic pipeline from verified NatureSpot records to Orca – the transfer currently involves a manual update process. Because of the pressure the LRERC staff are under, this can only be done periodically at present. Apart from wasting resources, this is rather frustrating for me – I've already added another 50 records in 2019 - a 9% increase in the database size with 7 new tetrads covered and two new species.

Before I had access to Orca, I had no record mapping tool available other than the NatureSpot Explore All Records interface (which does not cover all the records in Orca). Given the development of Orca I was unwilling to invest time and money in a standalone system such as MapMate as this feels like a backwards step (and too scared to plunge into QGIS), and so it was the Orca mapping tools I was most eager to investigate.

Current Orca VC55 Collembola map (map and data copyright of Leicestershire and Rutland Environmental Records Centre):


It is easy to generate maps like the one above in Orca simply by using the GUI tools in the Orca front end to filter to taxon or species level and then clicking “Map filtered records”. The good things from my perspective is that it is possible to overlay the VC55 boundary onto the interactive map, which is zoomable and can be interrogated by clicking on the dots. However, one thing the basic map display does not do is classic monad/tetrad/hectad mapping. Fortunately there is a solution to this in the form of an additional Orca module called eMapper.

Orca eMapper Collembola map (map and data copyright of Leicestershire and Rutland Environmental Records Centre):


The eMapper interface is a little more complicated than the basic map display, but it’s not hard to figure out using the graphical interface tools and a bit of experimentation. The maps produced are highly configurable and fully interactive.

eMapper zoomed in (map and data copyright of Leicestershire and Rutland Environmental Records Centre):


LRERC Collembola eMapper is set up as a static page which needs to be manually updated and does not reflect changes in the live database. This isn’t too much of an issue for me as at present we are only updating records annually. However, this isn’t so great when I’m planning my field work and square bashing trips, so I feel I need a separate system to help with my personal logistics. In addition, the eMapper display is very data rich, and for some purposes it’s easier to have a much simpler dataset, so what I’ve done at present is simply to take the Orca data and add it manually to a blank VC55 tetrad map by going into “classic MapMate emulation mode”. How easy it is to keep this up to date time will tell.

VC55 Collembola tetrad map:


Overall I’m delighted with Orca and very grateful to have access to it. It is a big advance for me in terms of the tools I have available for data management. My hopes for future developments include live dynamic data updates in both the database and eMapper, although this is some way off and not on the immediate horizon. Nevertheless, life with Orca means I never have to lie awake at night again worrying that QGIS is coming to get me.


Saturday, 5 January 2019

Tetrad Coverage - Square Bashing for Springtails

My plan for 2019 is fairly simple, to get more organized about tetrad coverage. The tetrad (a 2x2 kilometre square based on the National Grid) is the standard unit for biological recording. One of my problems at the moment is that I don't have any software which is well suited to tetrad recording. However, using the NatureSpot Explore All Records tool which I'm currently basing the Atlas on, I can generate approximate tetrad records (with quite a bit of faffing about).

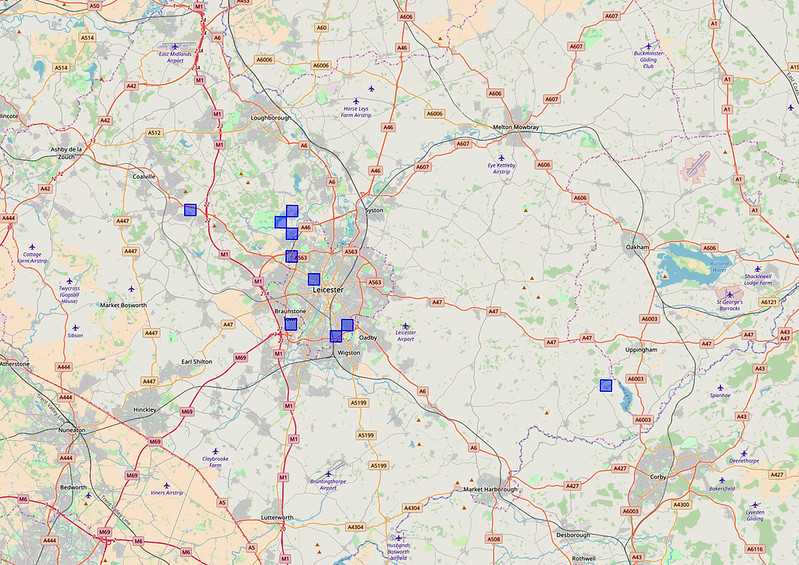
VC55 All Collembola records:
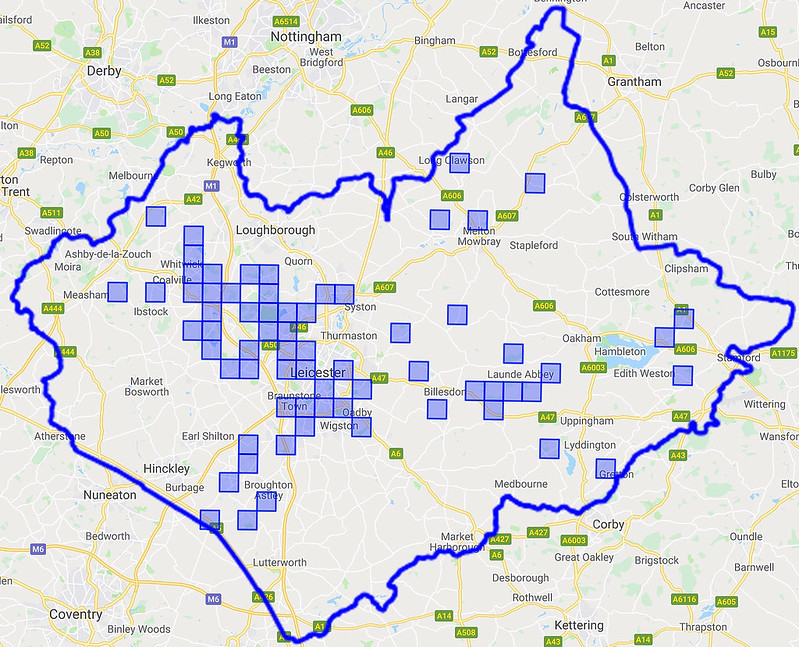
VC55 Collembola Tetrads

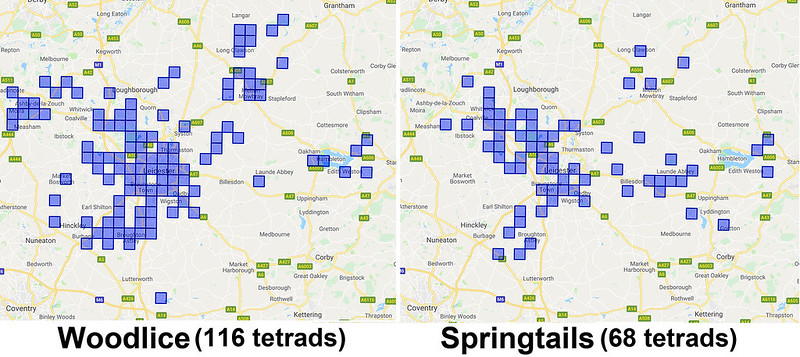
While the pattern of recording generally follows that for other taxons in VC55, what this current map reveals is that there are plenty of gaps to be filled. So far, so simple - drive almost anywhere and record springtails! The next step is a little more complicated - comparing VC55 Collembola records with other taxons. I have decided to adopt two benchmarks for this. The first is a comparison of springtail and woodlice records. I chose to use woodlice because while they are not too far away from springtails, they are more familiar to most people and the common species generate more records than springtails. Thus woodlice represent the next step up the recording hierarchy:

Woodlice vs Springtails

I'm moderately encouraged by this. As expected there are rather more woodlice records in VC55 but this clearly represents an achievable target. The second stage of benchmarking involes correcting for recording effort. Peter Shaw makes a strong case for adopting Orchesella cincta as a benchmark for recording effort/bias:

"... the genus Orchesella is taxonomically uncomplicated and species may be determined by eye using colour patterns. Distribution data for Orchesella species in the UK should therefore be reliable. The commonest and most distinctive is Orchesella cincta (Linnaeus, 1758), with 230 UK records of this species dating back to 1834 (Templeton 1835). The UK distribution map shows a strong bias towards the London area, with very few records in Cornwall, Wales or northern Scotland. Since the rst author of the present review has collected this species with approximately equal ease in all parts of England, Wales and the Scottish lowlands, this distributional bias in fact surely refects recorder bias, though its apparent absence from high mountains may be accurate, as it is said to be replaced by Orchesella alticola. In summary, the main infuence visible on the biogeography of this common, large and distinctive species in the UK is recorder bias. For less common or distinctive species this bias can only be worse."
Shaw, P., et al (2013) Updating taxonomic biogeography in the light of new methods–examples from Collembola. Soil Organisms, 85(3), 161-170.

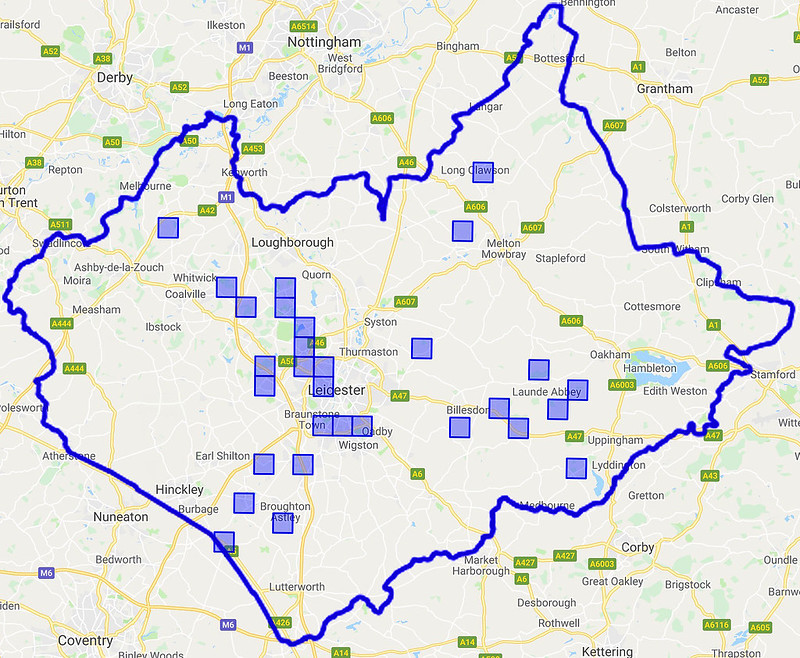
VC55 Orchesella cincta records:
VC55 Orchesella cincta records

To date there are 29 tetrads with Orchesella cincta records, indicating the distance left to travel. It's not clear to me what represents an "acceptable" level of coverage, but these indicators at least allow measurement of progress.


Tuesday, 26 June 2018

Towards a VC55 Springtail Atlas

A few other counties (Shropshire, Lancashire) have ambitious and well-advanced plans to build county atlases of springtails. There are presently no such plans for VC55 (Leicestershire and Rutland), but we do have a secret weapon that the other counties do not have - NatureSpot! In thinking about building a species atlas, there are a few problems which occur to me:

Tools
While there are good free mapping tools available, they require skills which I do not have and realistically will not be able to develop. However, the NatureSpot Explore All Records page provides a simple way of generating maps based on the NatureSpot (=iRecord) dataset, and this is what I have used to derive the maps below. There are a few problems with the Explore tool as it is presently configured, e.g. you can't drill down to individual records by clicking on the map (although all the individual records are listed, with submission evidence, e.g. photos). [UPDATE: my mistake, the NatureSpot maps are clickable - click on the "?" icon then on the square to see the record.] However, it seems to me that this is a viable way to generate an atlas. The only viable alternative that I can see would be the NBN Atlas maps (which are clickable). The NBN maps include a much bigger dataset than NatureSpot, including all the records from the former Collembola Recording Scheme (approximately 10,000 records covering Great Britain and Ireland for 359 species, collected between 1808-2008). However, having read what Steve Hopkin had to say about the accuracy of this dataset, I'm inclined to stick with the contemporary NatureSpot records. It costs a significant amount of money to keep NatureSpot (a registered charity) online and to develop features such as the Explore All Records page. Please make a small donation to keep us going: http://www.naturespot.org.uk/support_naturespot

Coverage
I have two major problems with coverage - geographical and species groups. For a single private individual, VC55 is a pretty big patch, and without more boots on the ground it is not going to be possible to get systematic coverage of the whole vice county throughout the seasons. Springtails are likely to remain Cinderella species and I can't imagine that I would ever be able to attract the public engagement that the Hoverfly Recording Scheme or Butterfly Conservation have done. I'm not sure what can be done about this problem. Another problem is my ignorance of the Poduromorpha, something I need to work on. Cute and photogenic though the globbies may be, I can't ever pretend to have generated a representative atlas without better taxonomic coverage.

Phenology (cyclic and seasonal natural phenomena in relation to climate)
It is only in recent months that I have become aware of the significance of phenology to Collembola, and this just multiples the geographic coverage problem. (Another thing the NBN maps have going for them are the nice phenology charts.)

BUT - having thought about the downsides, what do we have?


VC55 Springtail Atlas (all species, June 2018):
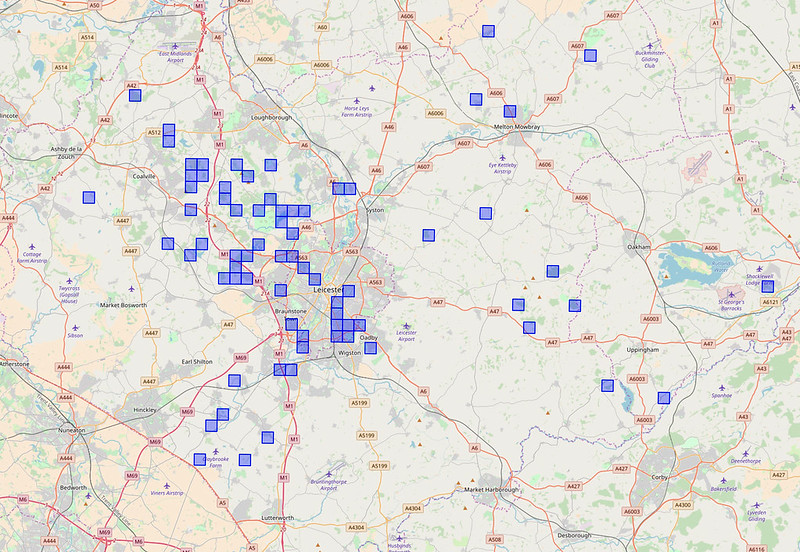
VC55 Springtail Atlas
This isn't as bad as it seems, the coverage reflects the overall pattern of recording in VC55, discussed here.


Single species, e.g. Orchesella cincta:
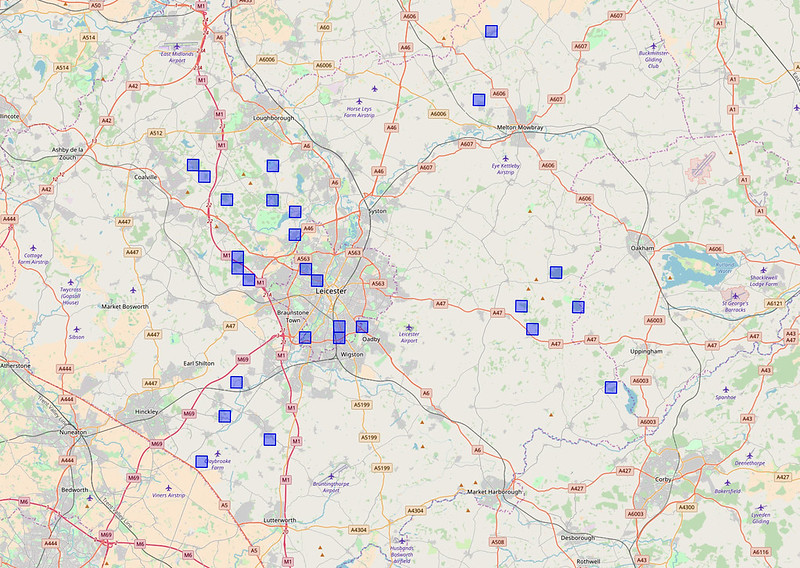
Orchesella cincta


Single genus: Deuterosminthurus spp:
Deuterosminthurus


Although they are not clickable, the maps are zoomable to get detailed coverage, e.g. Deuterosminthurus species:
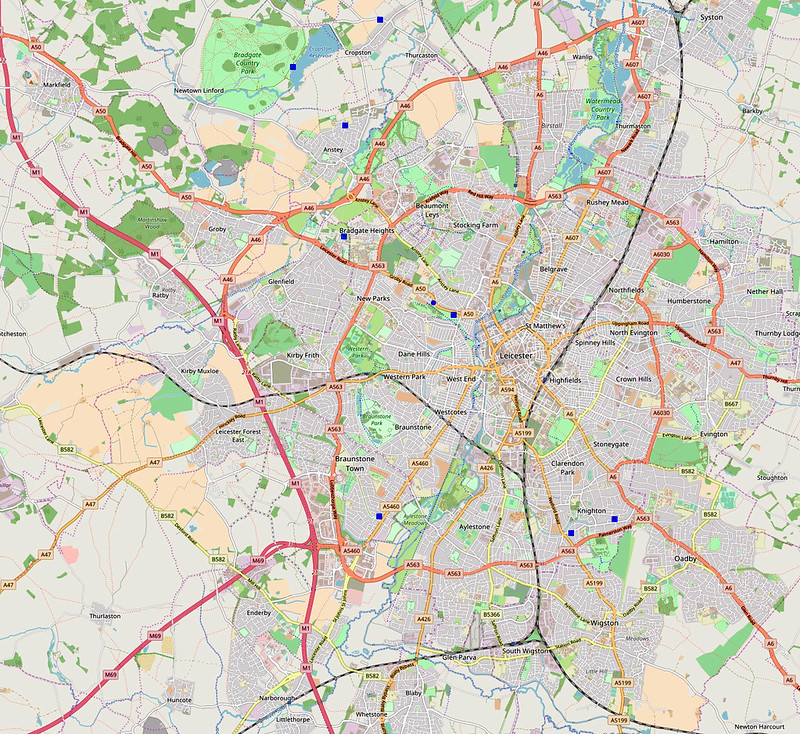
Deuterosminthurus zoom


DISCLOSURE:
I am a trustee of NatureSpot, registered charity 1138852.

Acknowledgements:
My gratitude to the hard working NatureSpot team and our developer John Van Breda for making it possible for me to even consider this.